如果结果不匹配,请
 更多“简述短期平均成本曲线与平均变动成本曲线、边际成本曲线的关系”相关的问题
函数至少在取a、b、c、d四个参数值时与U形平均成本曲线相一致。
Suppose the long - run total cost function for an industry is given by the cubic equation TC =a+bq+cq2+dq3. Show (using calculus ) that this total cost function is consistent with a U - shaped average cost curve for at least some values of a, b, c, d.
假设厂商成本为C(q)=16+4q2。
(1)求出平均成本、固定成本、可变成本、平均可变成本和平均固定成本。(提示:边际成本为MC =8q。)
(2)在图上画出成本、边际成本和平均可变成本曲线。
(3)求出最小化平均成本的产出水平。
(4)当价格在哪一区间时厂商产量为正?
(5)当价格在哪一区间时厂商利润为负?
(6)当价格在哪一区间时厂商利润为正?
Suppose the same firm's cost function is C(q)=16+4q.
a. Find variable cost, fixed cost, average cost average variable cost. and average fixed cost.(Hint: Marginal cast is given by MC =8q. )
b. Show the average cost, marginal cost, and average variable cost curves on a graph.
c. Find the output that minimizes average cost.
d. At what range of prices will the firm produce a positive output?
f.At what range of prices will the firm earn a positive profit.
使用与练习1相同的信息。
(1)推导厂商的短期供给曲线。(提示:画出成本曲线的基本形状。)
(2)假如市场中有100家相同的厂商,市场供给曲线是怎样的?
Use the same information as in Exercise 1.
a. Derive the firm's short - run supply curve. (Hint: You may want to plot the appropriate cost curves. )
b. If 100 identical firms are in the market, what is the industry supply curve?
表5一1(即教材第147页的表5―2)是一张关于短期生产函数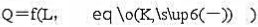 的产量表:
的产量表:
表5一1短期生产的产量表
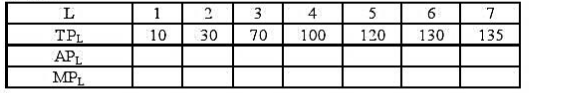
(1)在表中填空。
(2)根据(1),在一张坐标图上作出TPL曲线,在另一张坐标图上作出APL曲线和MPL曲线。(提示:为了便于作图与比较,TPL曲线图的纵坐标的刻度单位大于APL曲线图和MPL曲线图。)
(3)根据(1),并假定劳动的价格w=200,完成下面相应的短期成本表,即表5一2(即教材第147页的表5一3)。
表5-2短期生产的成本表
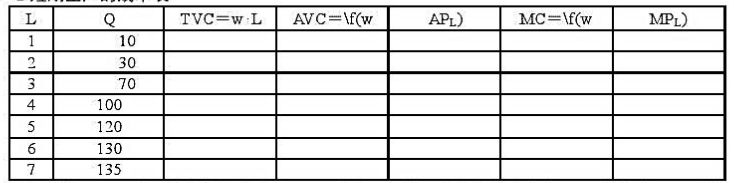
(4)根据表5一2, 在一张坐标图上作出TVC曲线, 在另一张坐标图上作出AVC曲线和MC曲线。(提示:为了便于作图与比较,TVC曲线图的纵坐标的单位刻度大于AVC曲线图和MC曲线图。)
(5)根据(2)、(4),说明短期生产曲线和短期成本曲线之间的关系。